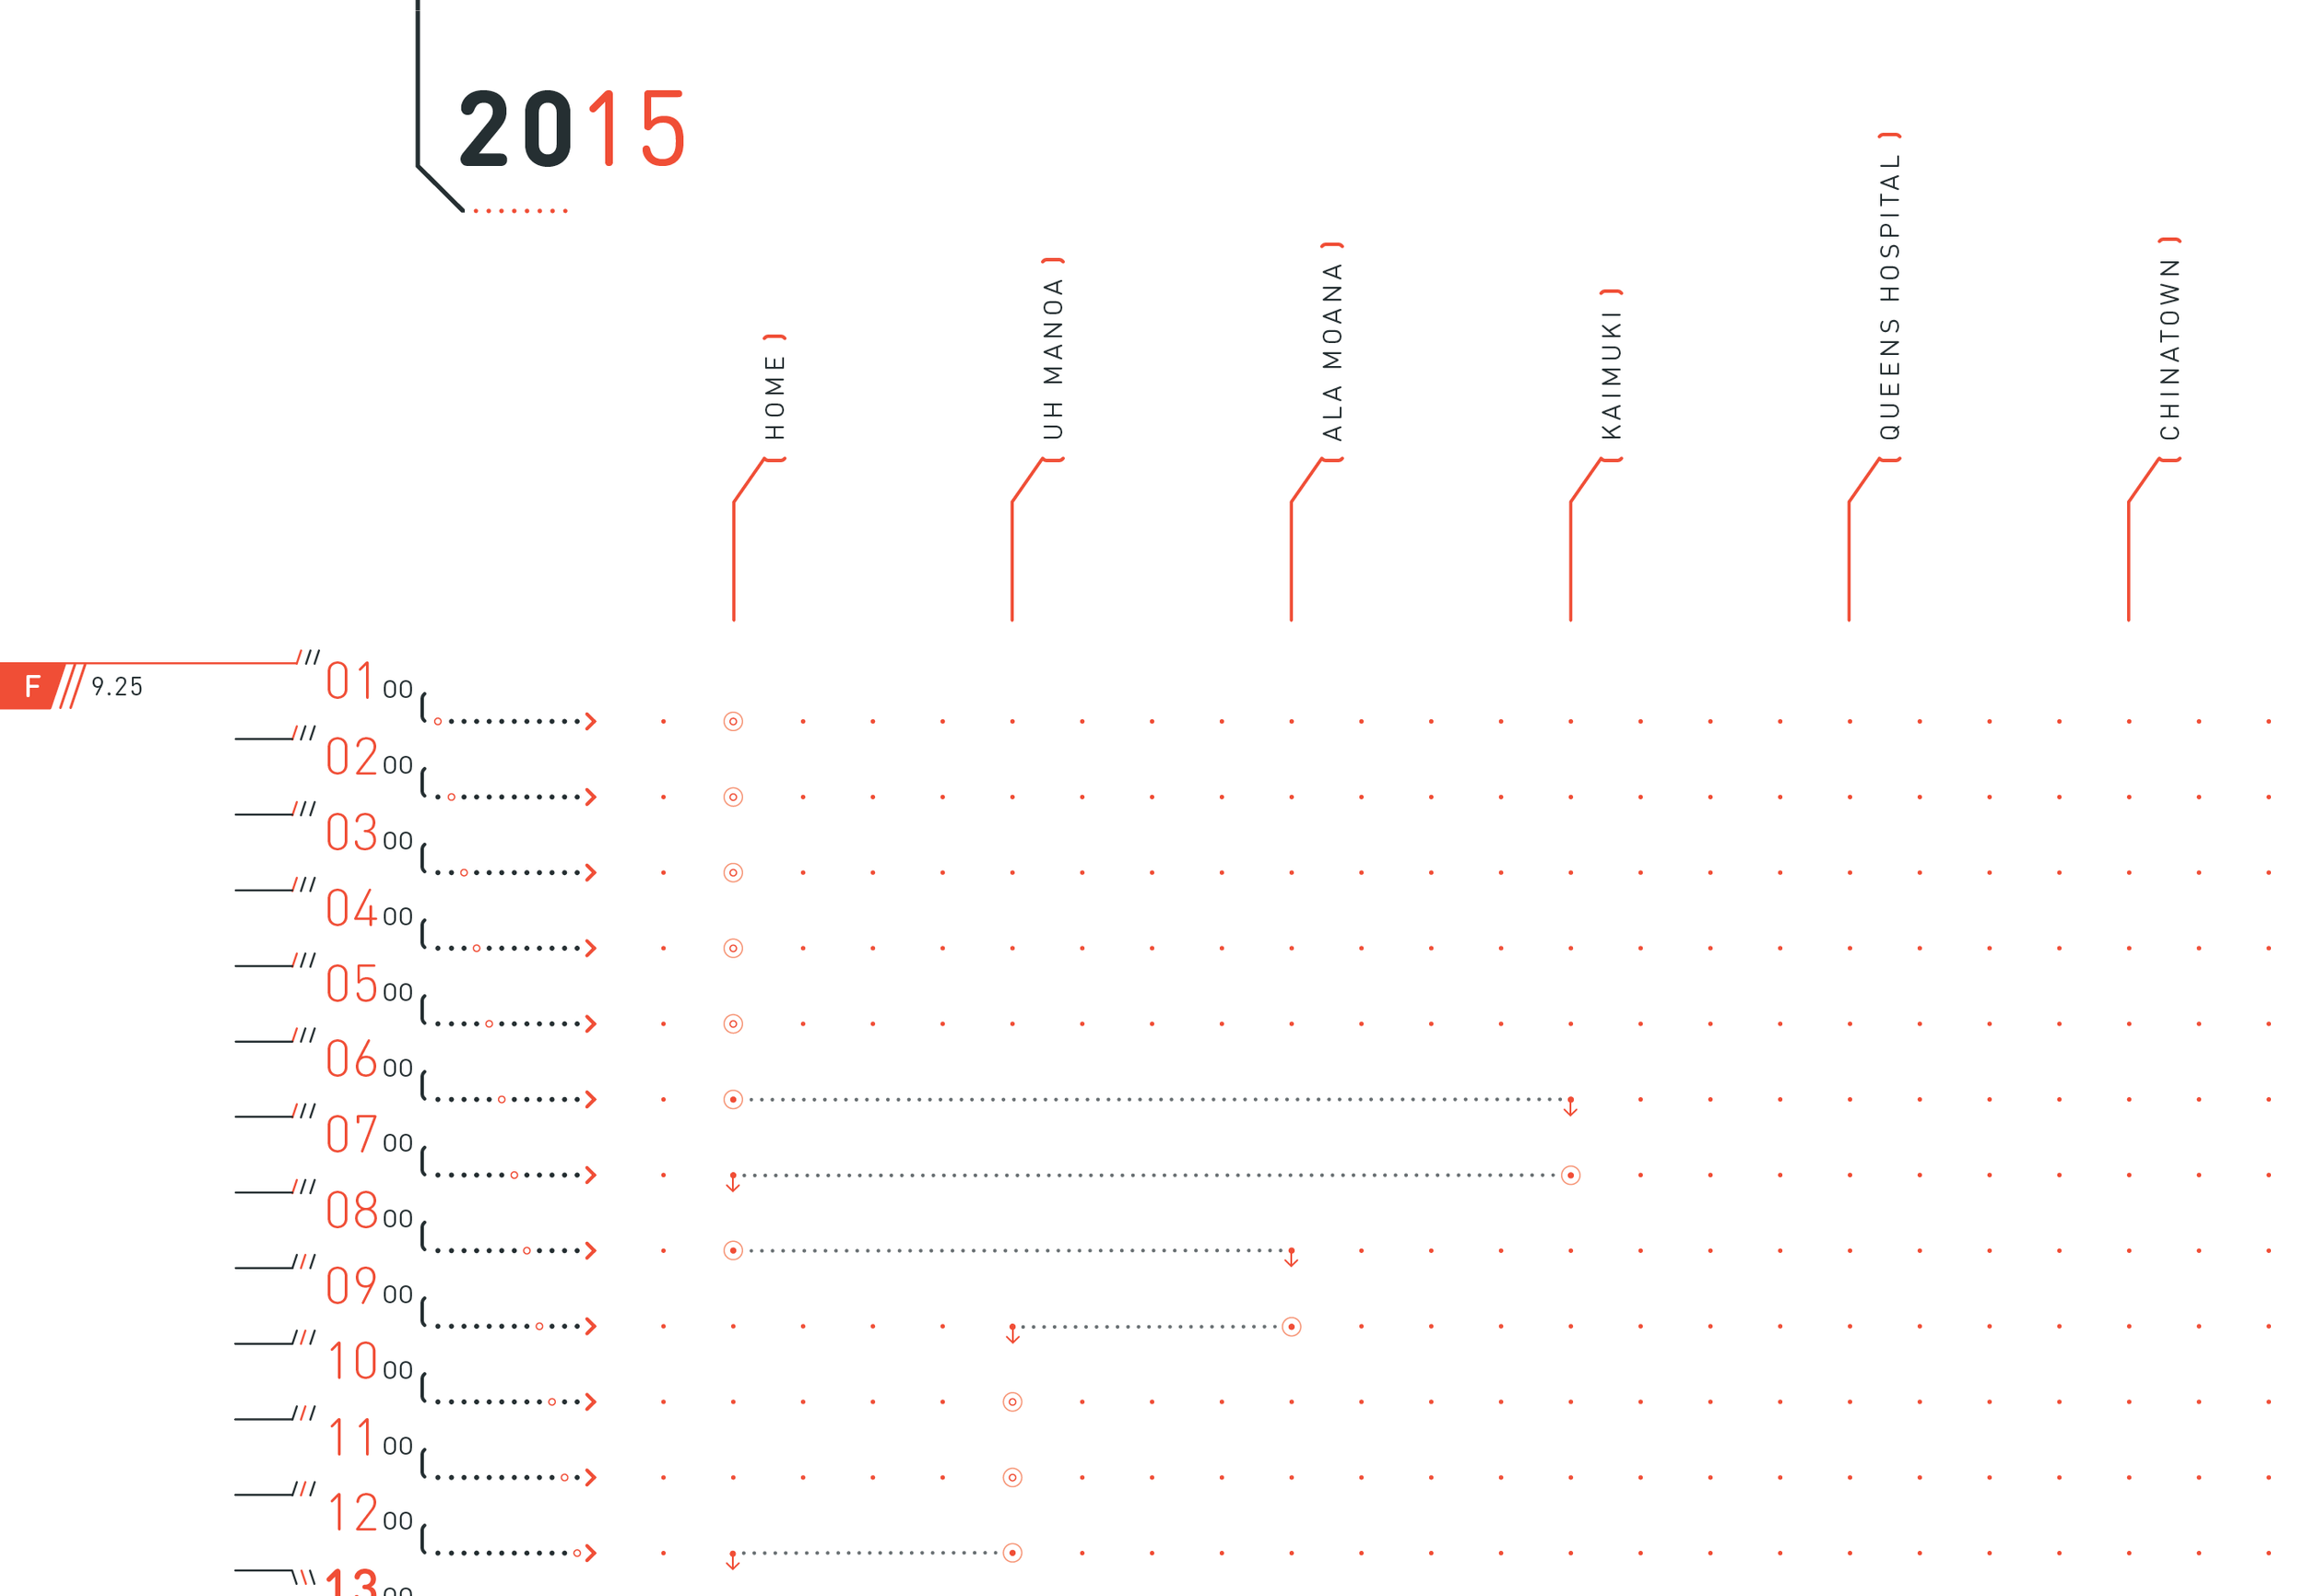


Timeline
An exploration into data visualization using typographic marks. From glyphs from the Din Round family, a grid system was created to describe a week of my personal life. Sub-divided into three categories: location, event and priority; each use a unique system of markings to correspond with the time of day.
Highlighting the rounded terminals of the typeset, while maintaining the rigidity of the original, the graphical elements incorporate hashmarks and diagonals contrasted with circles and dots. A vibrant orange breathes life into this German typeface.
Date
2015
Material
Matte 100# Paper

Entire project printed on one long sheet of paper and accordion folded.

Various systems using type were created to display collected data.